The St. Petersburg Stock Exchange, 1865–1917

For half a century the St. Petersburg Bourse was the capital market of the Russian Empire. From the hand-collected monthly quotations of every listed security, 1865–1917, we reconstruct the market and its industries — and use this deep, pre-modern market to test why momentum exists. Explore the indexes below, read the paper, and download the data to replicate the results.
The research
Momentum in Imperial Russia
William N. Goetzmann & Simon Huang — Journal of Financial Economics 130 (2018), 579–591.
Leading theories of momentum make different predictions depending on a market’s composition and institutions. We assemble a security-level dataset for a major nineteenth-century equity market — the St. Petersburg Stock Exchange, with limited delegated asset management — to test them. A strategy that buys recent winners and sells recent losers earned a significant, positive return that grew with the holding period, and an 1893 regulatory change lets us test behavioral explanations directly. We find no support for the agency (institutional) theory and evidence consistent with investor overreaction. The market as a whole compounded at roughly 5.8% a year in price terms over 1865–1914.
Momentum · behavioral finance · return predictability
NBER Working Paper 21700 ↗ Published paper (PDF) Explore the indexes ↓
Momentum, buy–minus–sell (3-month formation)
| Holding period | 3 mo | 6 mo | 9 mo | 12 mo |
|---|---|---|---|---|
| Winners (buy) | 0.58 | 0.69 | 0.70 | 0.74 |
| Losers (sell) | 0.43 | 0.41 | 0.40 | 0.32 |
| Winners − losers | 0.14 | 0.28 | 0.30 | 0.43 |
| (1.2) | (2.9) | (3.5) | (5.4) |
Average monthly return in percent; t-statistics in parentheses. From the paper’s momentum tables. The winner–loser spread strengthens with the holding horizon.
The market, reconstructed
Series
The primary sources
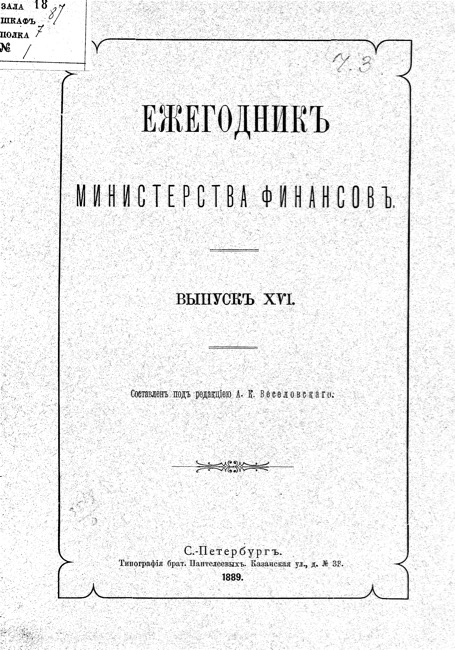
Every price in this database was hand-collected from the printed record of the Imperial Russian state itself: the Ézhegodnik Ministerstva Finansov — the “Yearbook of the Ministry of Finance” — and its companion statistical volumes, published in St. Petersburg from the 1860s onward.
Each annual volume tabulated, security by security, the monthly high and low (vysshaya / nizshaya) quotation on each Russian bourse, together with the par value and coupon rate. Below are the scanned pages for every year, 1865–1917 — the raw material behind the indexes above, free for anyone to check against.
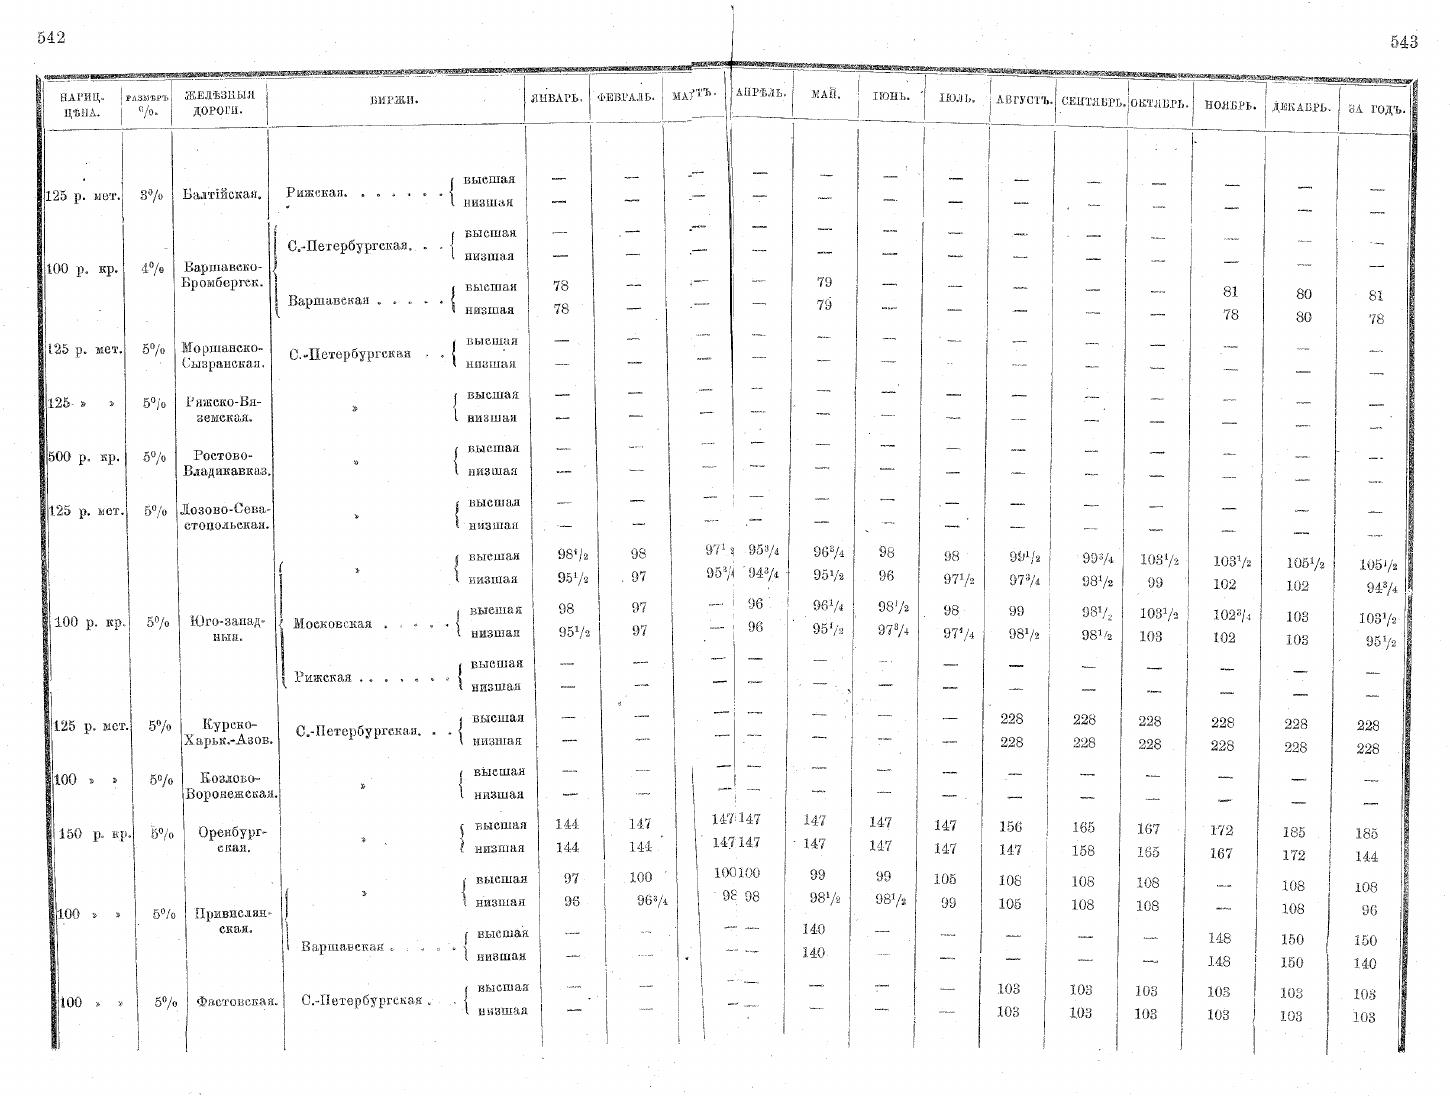
Source citations for every year: English · Russian. Scans collected by W. Goetzmann, C. Cabolis & P. Radchenko for the Yale ICF. Academic use only.
The structure of the news
The Structure of Russian Financial News
A companion project reads the Russian financial press — Vestnik Finansov, Promyshlennosti i Torgovli (“Herald of Finance, Industry and Trade”), the finance ministry’s official weekly, 1883–1917 — end to end. Topic models and Cyrillic diachronic word embeddings recover how the Empire’s financial reporting was organized and how it changed across a half-century of industrialization, crisis, and war.
Open the news site →Data & links
Download & replicate
Index series (CSV) Index series (JSON) Full security-level data (ZIP, 2 MB) ICF project page ↗The ZIP bundles the master workbook (monthly prices for every listed security, English + Cyrillic names, and annual dividends, 1885–1915 with source citations), the 40 industry return indexes, and the paper’s market/momentum series. The interactive indexes above are price / capital appreciation: a faithful total-return index awaits reconciling each security’s quotation basis (bonds were quoted as a percent of par, shares in rubles), so the dividend data is provided here for that work rather than folded in prematurely. Academic use only.
Related