The London Stock Exchange, 1869–1929

The Investor’s Monthly Manual recorded the world’s largest securities market month by month for six decades. From its hand-collected record we reconstruct the London market — its return, its risk premium, and how the reward for bearing risk fell as you climbed the capital structure from common stock to preferred shares to bonds. Explore the indexes below, read the papers, and download the data to replicate the results.
The research
Capital Structure, Seniority, and Risk Premia
Evidence from the London Stock Exchange, 1870–1929
Using security-level data from the Investor’s Monthly Manual, we build capital-weighted return indexes for the London market and measure the reward for risk at each level of the capital structure. We find a persistent equity risk premium of about 3.7% over commercial paper and 4.5% over long-term government bonds, and returns that decline monotonically with seniority — common stocks earned more than preferred shares, which earned more than corporate bonds. The rolling ten-year stock-minus-bond spread was positive in every interval of the sixty-year sample. Most of the total return came from income, not price appreciation, as the explorer below makes plain.
Two write-ups, one dataset:
NBER Working Paper 34899 ↗ Book chapter (PDF) Explore the indexes ↓
Goetzmann & Rouwenhorst, NBER WP 34899 (Feb 2026). A companion chapter appears in the Ibbotson volume (with Fernando Reyes De La Luz).
The seniority ladder — UK, top-100 firms, 1870–1929
| Asset class | Return | Std dev | Sharpe |
|---|---|---|---|
| Common stock | 7.33 | 7.77 | 0.44 |
| Preferred stock | 4.18 | 6.01 | 0.08 |
| Corporate bond | 3.62 | 4.90 | −0.01 |
| Municipal bond | 3.36 | 4.36 | −0.06 |
| Government bond | 2.88 | 4.39 | −0.16 |
| Commercial paper | 3.67 | 1.19 | — |
| Inflation | 1.18 | 6.31 | — |
Annualized percent (arithmetic mean), Sharpe ratio over commercial paper. Table 1, Panel A of NBER WP 34899. Return falls at every step down the seniority hierarchy.
The market, reconstructed
Segments
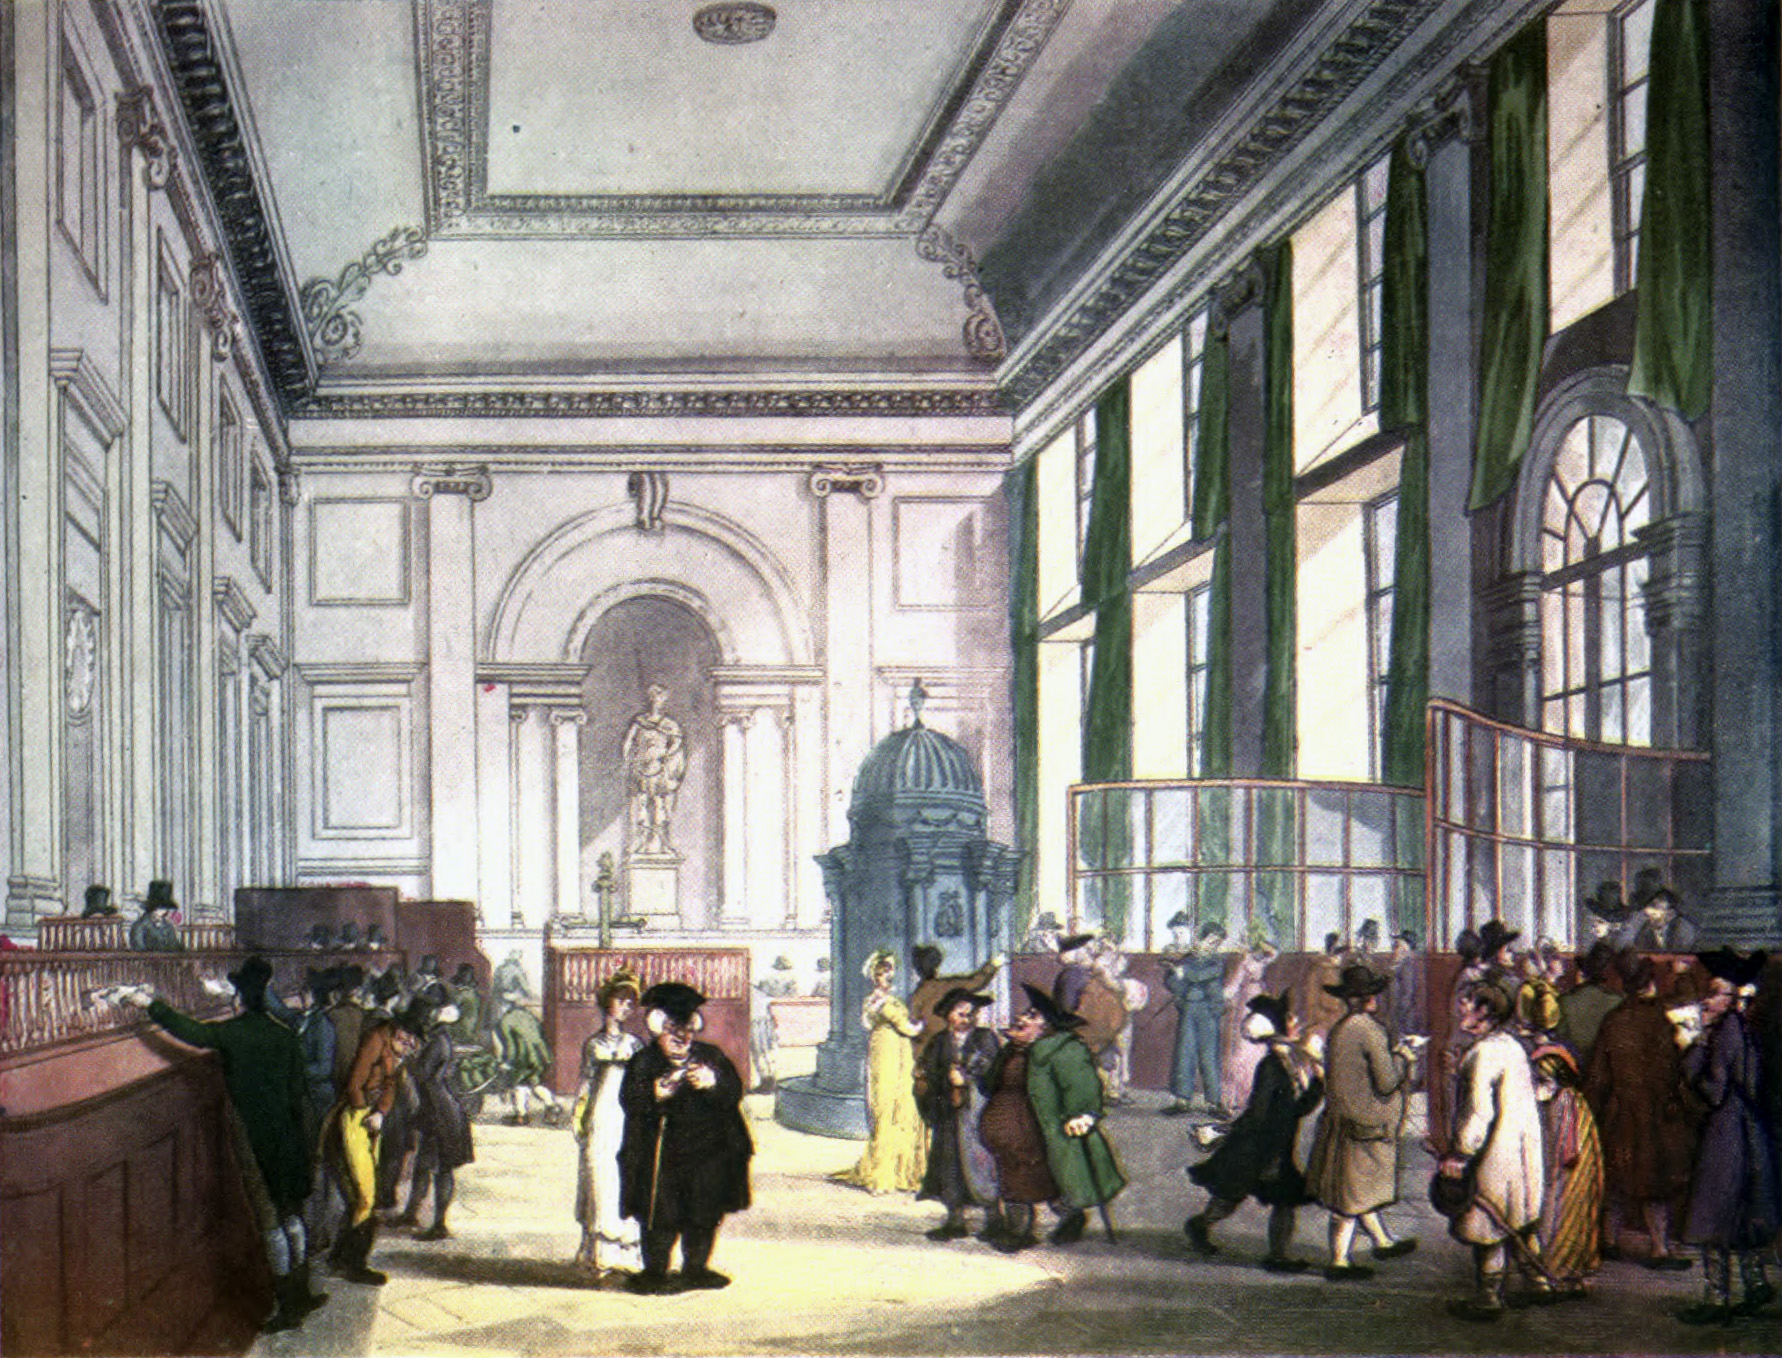
The structure of the news

The Structure of London Financial News
A companion project reads the London financial press — the Investor’s Monthly Manual and The Statist — end to end, using topic models and diachronic word embeddings to trace how reporting shifted from terse price records to narrative-driven coverage over roughly 150 years.
Open the news site →Governance & geography · exploratory
Who ran these companies, and where? From the December annual issues of the IMM we extract each firm’s chairman, secretary, and registered office, then geocode the addresses. The map below places roughly 370 City of London companies in 1890, coloured by sector — a first look at the physical geography of Victorian finance. Extending this to board interlocks and directorial dynasties across 1880–1929 is work in progress.
Data & links
Download & replicate
Index series (CSV) Index series (JSON) 1890 officer/address data (CSV) Replication script (Python) Full IMM security-level data (ZIP, 6 MB)The interactive indexes are computed from the
same annual security-level file the paper uses. The ZIP bundles the full
IMM_A_11_25_2025.csv (~162,500 rows, 1870–1929) with the Bank-of-England and
Jorda–Schularick–Taylor macro inputs, so the replication script below runs end to end.
Related