The Shanghai Stock Exchange, 1870–1940
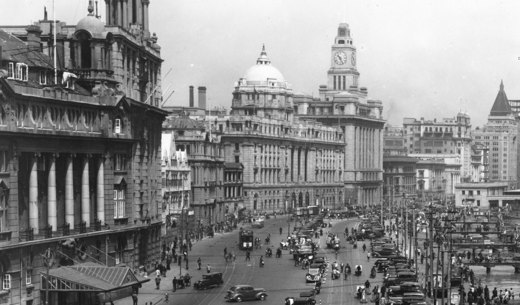
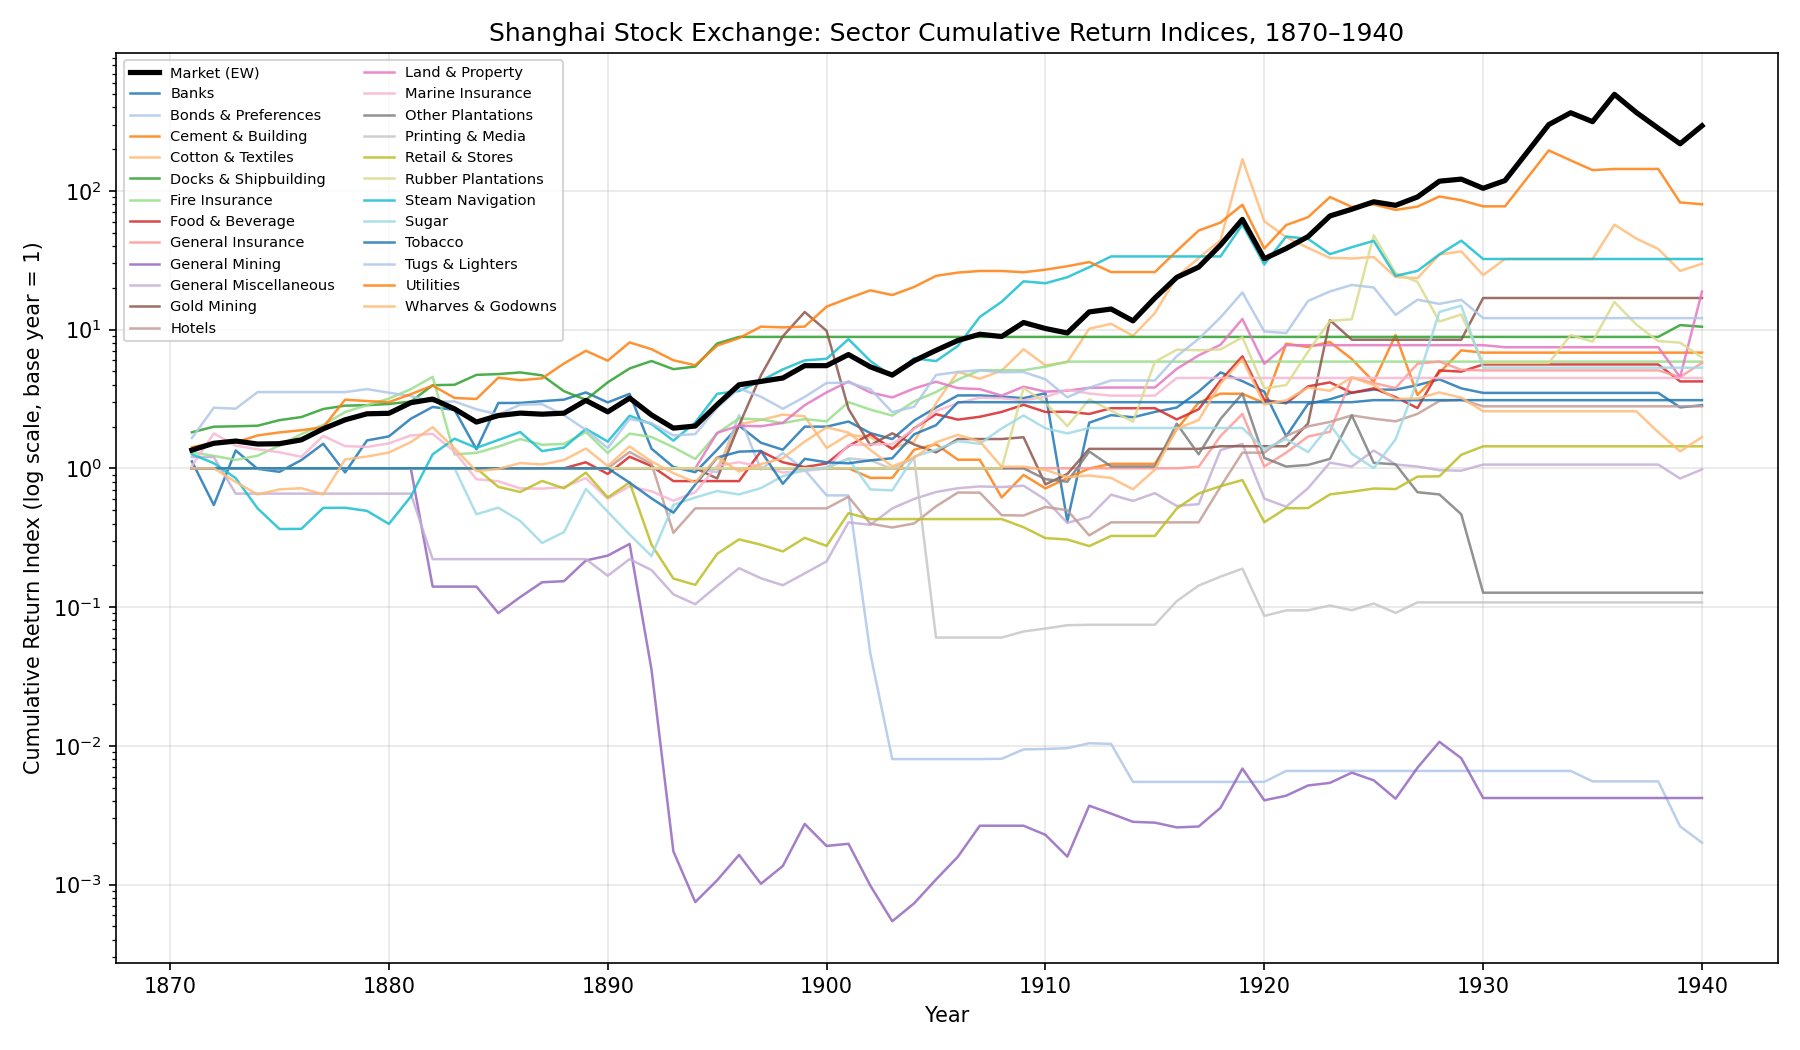
For seventy years the Shanghai share market was the securities market of treaty-port Asia — a place where a British bank, a Chinese cotton mill, a Malayan rubber estate, and a Shanghai tramway were all quoted side by side, in three different currencies. From year-end share lists hand-collected for every year from 1870 to 1940 we reconstruct the market and its two dozen industries, and use them to ask what a boom in a frontier market actually predicted. Explore the indexes below and download the data to replicate the results.
The research
Booms, crashes, and bubbles on a frontier exchange
Shanghai, 1870–1940 — work in progress
The reconstructed market compounded at about 7.1% a year in US dollars over seven decades, turning one dollar into roughly 158. Almost none of that was price appreciation: the price-only index rose just 0.7% a year. Shanghai was an income market — companies distributed nearly everything they earned, and sometimes more, and the shareholder’s return was the dividend cheque, not the capital gain. It was also a volatile market: the standard deviation of annual returns was 32%, and in a typical decade at least one industry index halved.
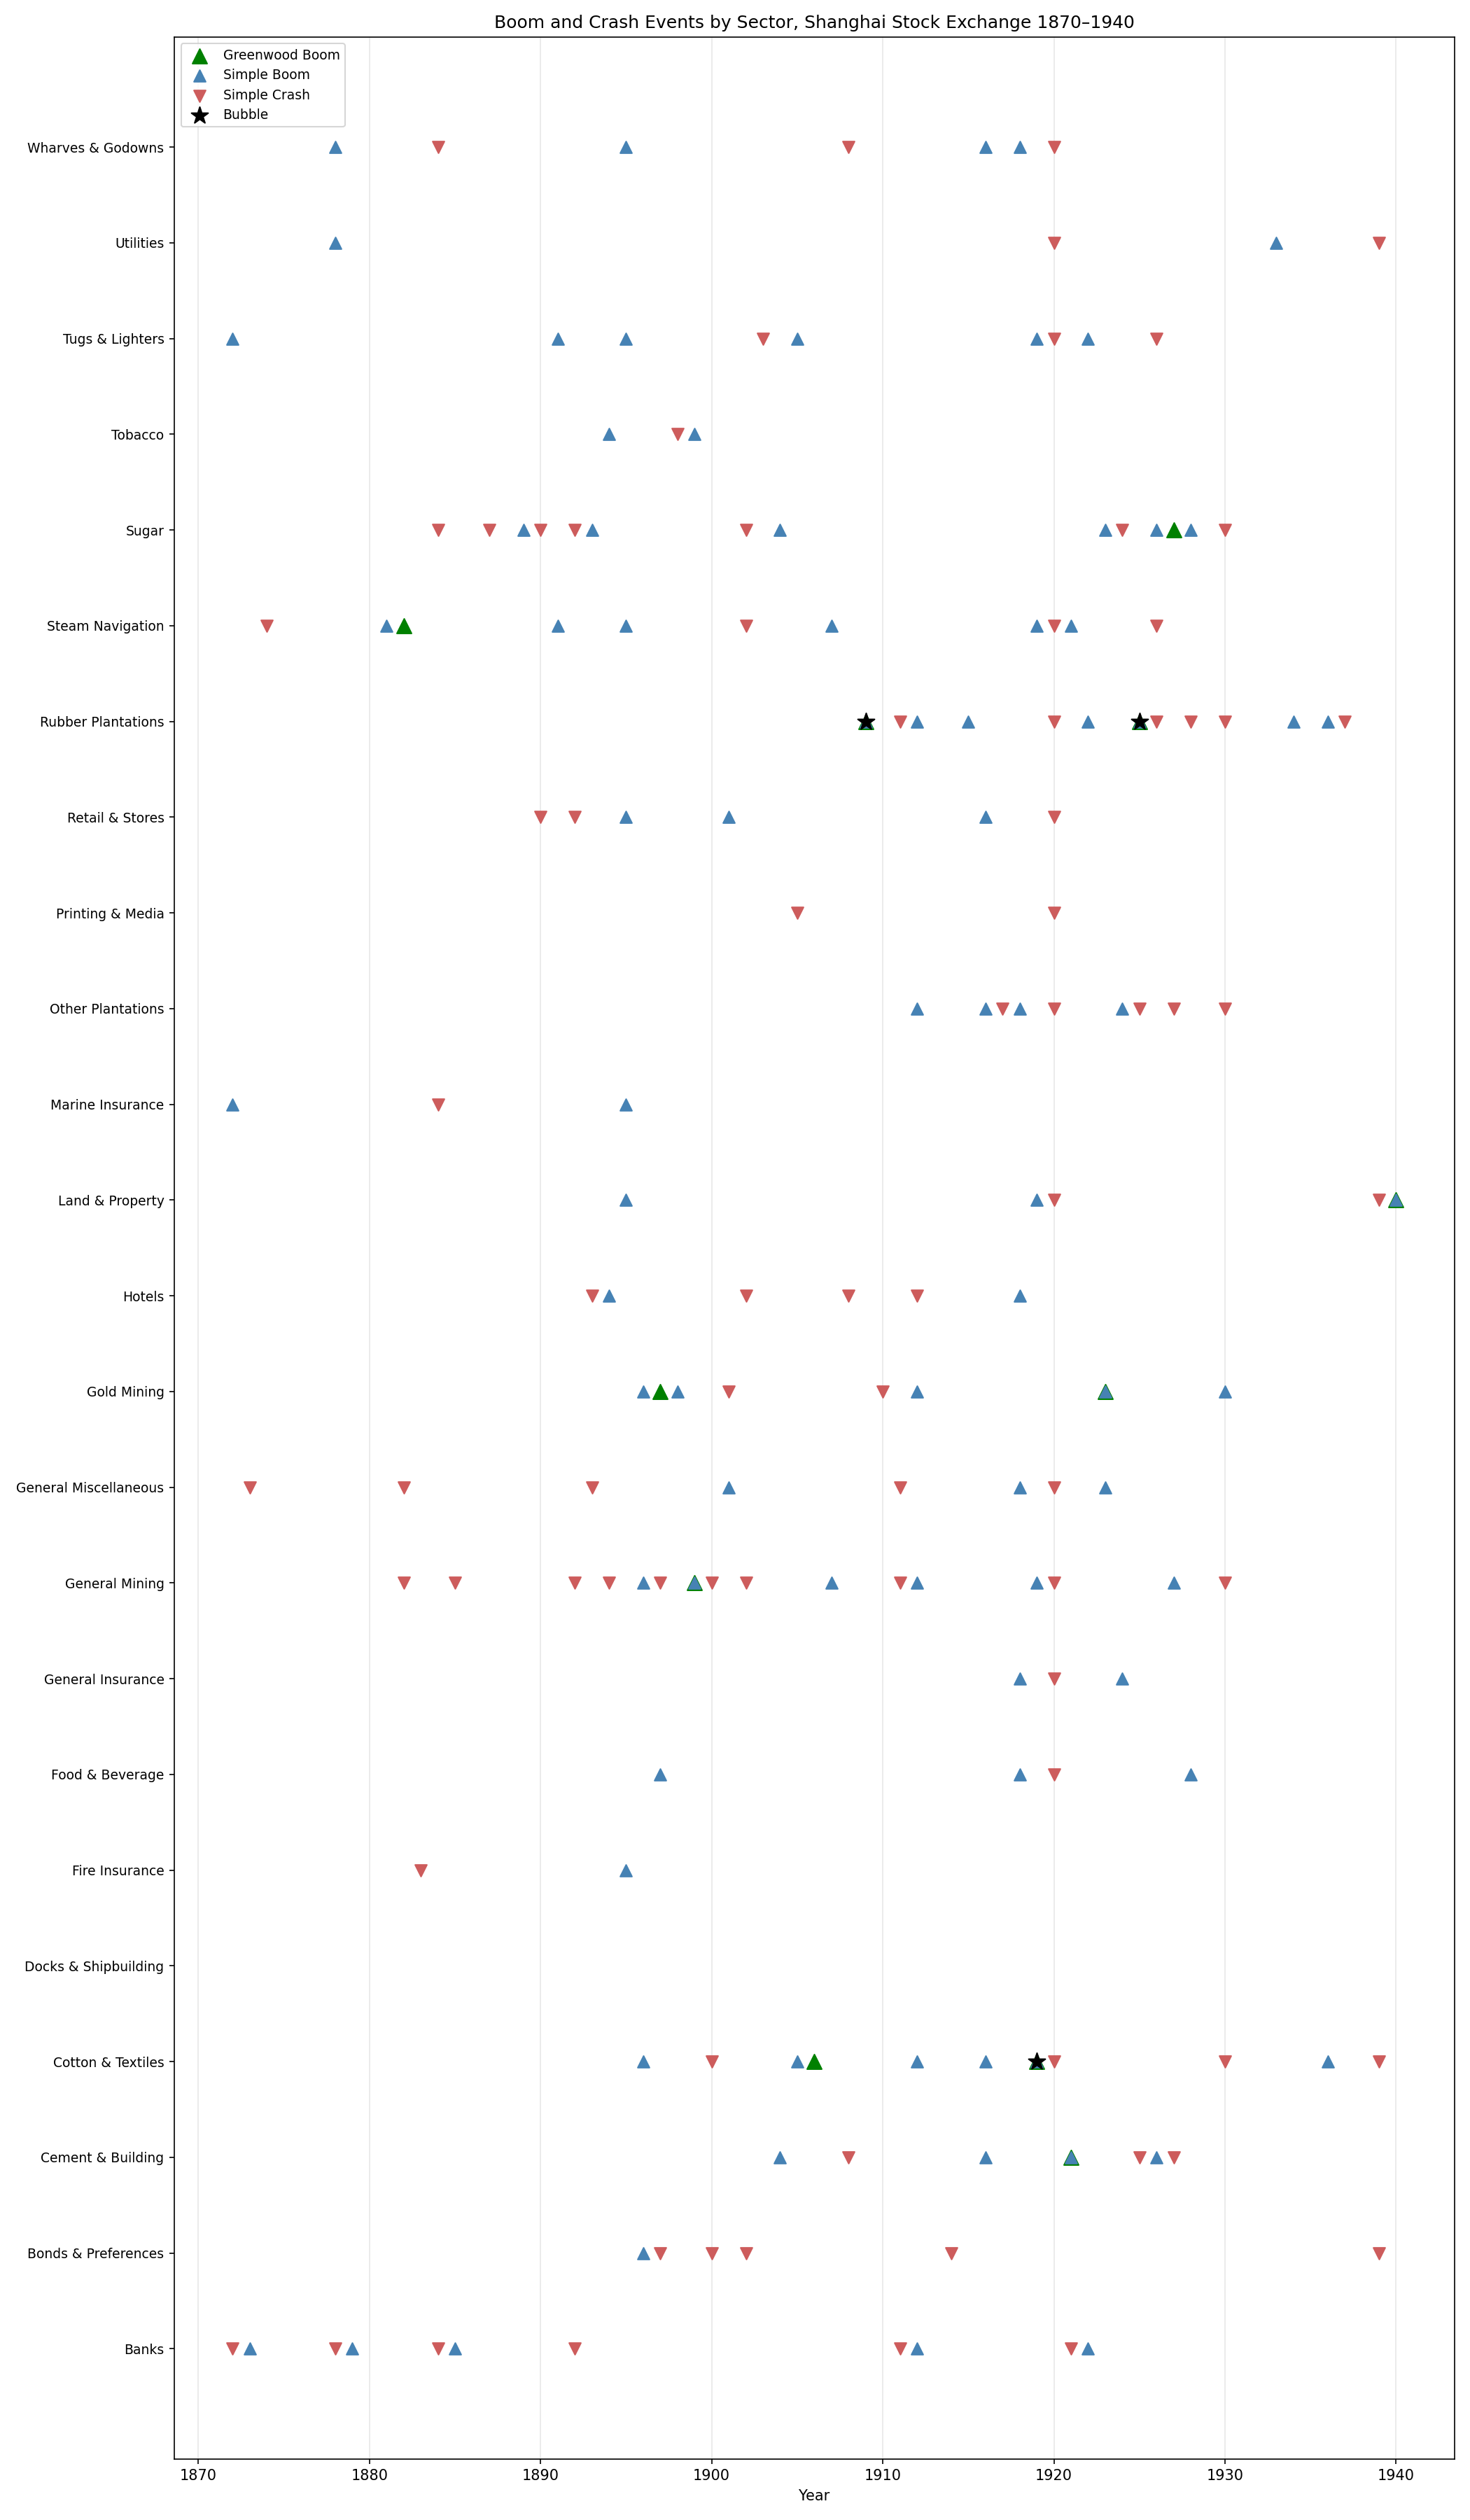
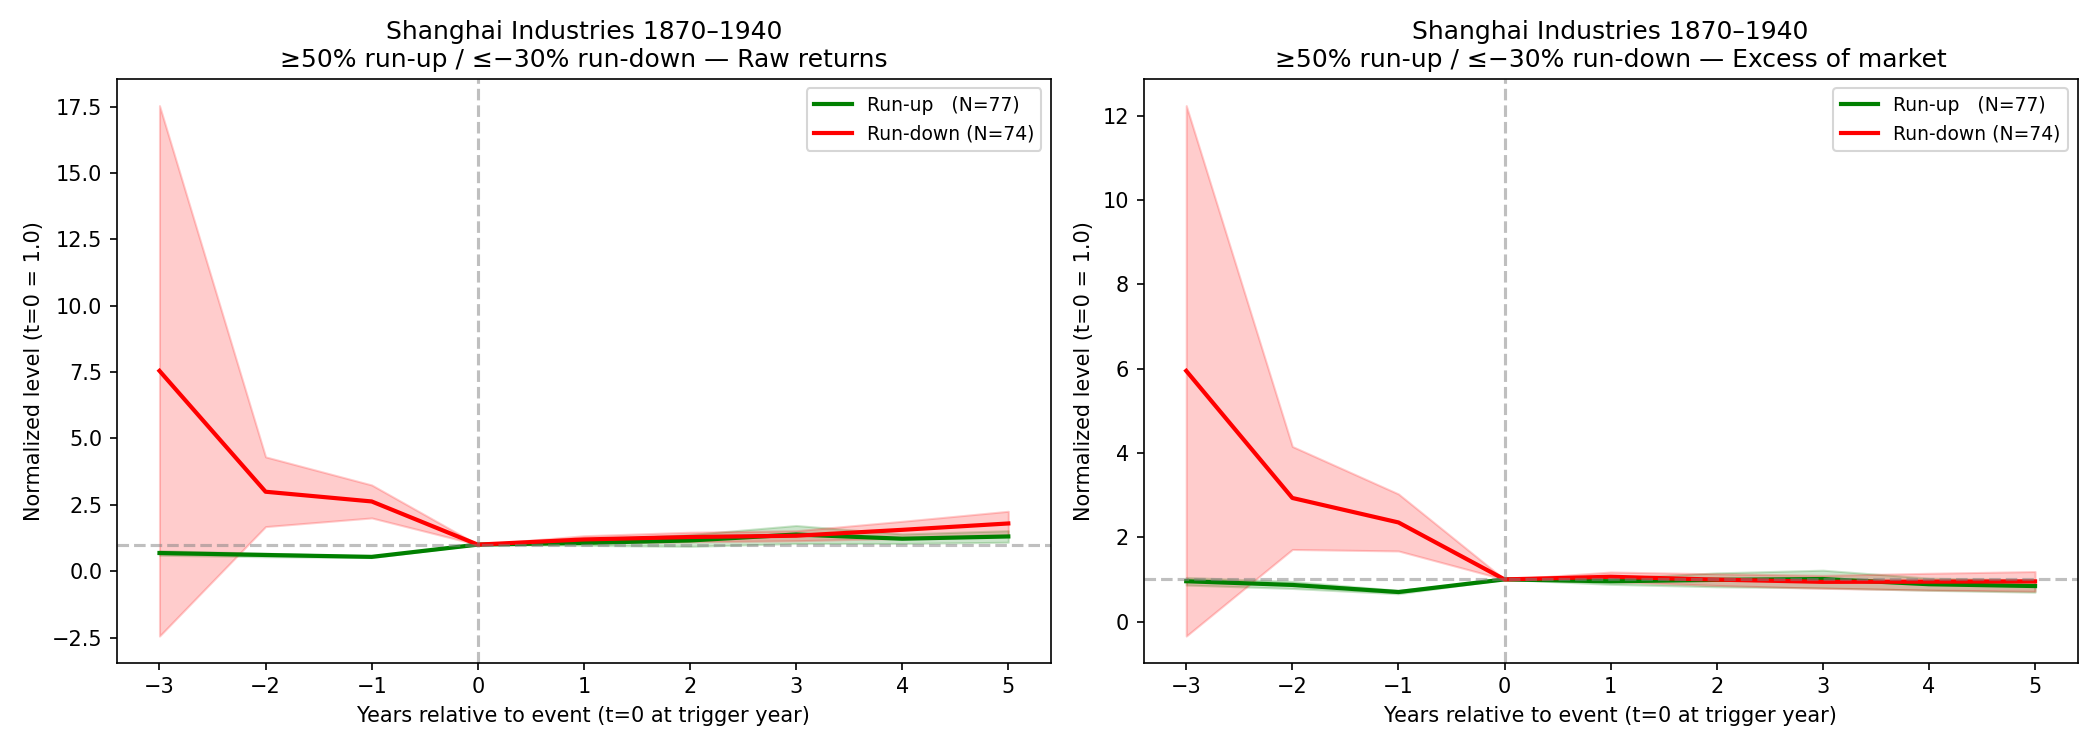
Applying the boom/crash classification of Goetzmann, Manninen & Tyler (2026) and the “Bubbles for Fama” test of Greenwood, Shleifer & You (2019) to the 24 sector indexes, we find 11 market-adjusted sector doublings over the sample. Only 3 of the 11 were followed by a crash of 40% or more within two years — the 1919 cotton-mill boom, and the rubber-plantation manias of 1909 and 1925. A doubling in Shanghai, as in the modern US market, was more often the start of a durable re-rating than the signature of a bubble.
Goetzmann–Manninen–Tyler, NBER WP 34903 ↗ Explore the indexes ↓ Booms & crashes ↓
Method: Goetzmann, Manninen & Tyler, “Bubbles, Booms and Crashes in the US Stock Market 1792–2024,” NBER WP 34903 (2026); Greenwood, Shleifer & You, “Bubbles for Fama,” JFE 131 (2019), 20–43.
The Shanghai market, 1871–1940 (US dollars)
| Index | Return | Std dev | 1940 level |
|---|---|---|---|
| Equal-weighted, total | 7.09 | 32.4 | 158.2 |
| Equal-weighted, price | 0.70 | 31.9 | 2.2 |
| Value-weighted, total | 3.14 | 28.2 | 5.5 |
| Value-weighted, price | −0.70 | 27.9 | 0.5 |
| Published index, 1900–40 | 9.74 | — | — |
| this rebuild, same window | 9.18 | — | — |
Geometric mean annual return in percent; standard deviation of annual returns. Value-weighted series begin in 1878, when share counts first become available. The rebuild reproduces the earlier ICF index over its 1900–1940 window with a correlation of 0.94 in annual returns, and extends it back thirty years to 1871.
The market, reconstructed
Booms, crashes, and bubbles
Sector indexes are where booms are visible. Following Greenwood, Shleifer & You, a boom is a sector that doubles over two years both in raw terms and relative to the market; a boom becomes a bubble only if the sector then falls 40% or more from its post-boom peak within two years. Shanghai produced eleven booms and three bubbles.
| Sector | Boom year | Crash year | Decline from peak |
|---|---|---|---|
| Cotton & Textiles | 1919 | 1920 | −64.4% |
| Rubber Plantations | 1909 | 1911 | −46.8% |
| Rubber Plantations | 1925 | 1926 | −46.6% |
The 1909–11 episode is the celebrated Shanghai rubber-share crisis: London and Shanghai investors bid up shares in Malayan rubber estates through 1909 and early 1910, the native banks that had lent against the shares failed when the price broke, and the panic pulled down two of the largest Chinese qianzhuang houses. The exchange’s rubber section had 43 quoted companies at its peak, more than any other sector in the seventy-year record.
The industries
| Sector | Years | Span | Max firms | Return %/yr | Growth of ×1 |
|---|
Equal-weighted total-return indexes, US dollars. Years counts the years with a computable return, which need not be contiguous. Rows in italics never had more than three firms quoted at once, or compound to less than 0.15 over their span. Their levels are driven by a handful of quotations — and, in General Mining and Bonds & Preferences, by changes in par value and quotation currency that the annual sheets do not always let one separate from a price change. Read them as illustrative of the raw record, not as sector returns. Click a column heading to sort.
The primary source
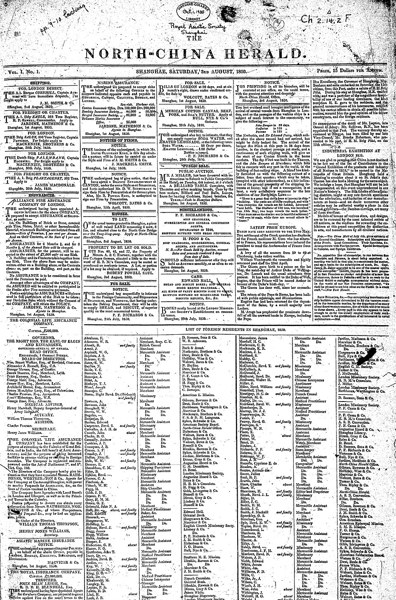
Behind every number here is one workbook of 71 annual sheets, one for each year from 1870 to 1940, hand-collected from the year-end share lists printed in The North-China Herald, the English-language weekly of the Shanghai treaty port. Each sheet records, company by company: the sector, the closing quotation and the currency it was quoted in, the number of shares, the par value, the paid-up value, and the dividend — with every figure also converted to US dollars so that the series can be compounded across a market that never settled on a single unit of account.
That last point is not a technicality. A single 1900 page quotes the Hongkong & Shanghai Bank at a percentage premium in taels, the Bank of China, Japan & Straits in pounds, shillings and pence, and a dozen local firms in Mexican dollars — and the tael/dollar rate itself moved from 1.52 to the US dollar in 1900 to 17.58 in 1940 as silver collapsed. The indexes on this page are dollar returns, so that depreciation is already inside them.
Shares were first quoted in Shanghai in June 1866, when a list of thirteen companies — the Hongkong & Shanghai Banking Corporation among them — appeared in a local paper under the heading “Shares and Stocks.” Quotation continued until 8 December 1941, when Japanese forces took the International Settlement; the exchange never reopened after the war.
The collectors kept running notes, decade by decade, on everything the tables could not hold: bonus dividends, liquidations that went on being quoted for years afterwards, recapitalisations, and forward delivery. They are reproduced here as collected.
“Futures market exist in Shanghai in this early era! … for HSBC old issue in 1871, the quote for cash sales is $189 but $205 for delivery in June.” Notes on the period 1870–1880
“Although the company has already been liquidated, it has been quoted in the papers for so long, and there are closing quotations. Shanghai Steam Navigation was first liquidated in 1877, but it was quoted in the papers until 1884.” Notes on the period 1870–1880
The structure of the news
The Structure of Shanghai Financial News
A companion project reads the treaty-port financial press end to end, using topic models and diachronic word embeddings to recover how Shanghai’s financial reporting was organized and how it changed across seventy years of concession-era commerce, revolution, and war.
Open the news site →Who collected this
The annual price and dividend record for 1870–1940 was collected from The North-China Herald by Christos Cabolis, Wenzhong Fan, William Goetzmann and Siew Choo (Julie) Ng for the Yale International Center for Finance, where the project has been maintained as an ongoing effort to gather prices and dividends for securities quoted in nineteenth- and early twentieth-century Shanghai. The index construction methods are documented by Wenzhong Fan.
The decade-by-decade collection notes quoted above were kept by the collectors as they worked through the run of the paper. The rebuilt indexes and the boom/crash analysis on this page were computed from that workbook; any errors in them are not the collectors’.
The original project page, with the construction-methods document, the per-year source files and the Access database, remains at the ICF: Shanghai Stock Exchange Project ↗
Data & links
Download & replicate
Index series (CSV) Index series (JSON) Company-level returns (CSV) Sector returns (CSV) Sector summary (CSV) Boom/crash events (CSV) Full data & code (ZIP, 1.5 MB)The ZIP bundles the source workbook
(SHARES VALUES IN $(final version 2).xls, 71 annual sheets, 1870–1940), the two
build scripts that turn it into the company panel, the sector indexes and the boom/crash tables, the
earlier published ICF index used for validation, and the collectors’ decade-by-decade notes.
The company panel holds 3,471 company-year observations on roughly 400 firms.
Academic use only.
Related