Historical Markets
The Old New York Stock Exchange, 1815–1925
A monthly record of individual security prices on the New York Stock & Exchange Board and its successor, from the year the Board began keeping minutes to the eve of the great bull market — together with the newspaper price lists that reach back to 1800, before there was an exchange to report.

The New York Stock & Exchange Board was organised in 1817 out of an informal market that had been trading federal loans, bank shares and insurance stock in the coffee houses of lower Manhattan since the 1790s. This project reconstructs what traded there, and at what price, month by month for 111 years.
The research
A new historical database for the NYSE 1815 to 1925: Performance and predictability
William N. Goetzmann, Roger G. Ibbotson and Liang Peng
We collected monthly prices for every security we could find quoted in New York from 1815 onward, built a price-weighted index from them, and asked what the nineteenth-century American market actually returned. The long-run capital appreciation is modest — most of the return to holding equities in this period came as dividends, not price growth — and the series shows the predictability and volatility clustering familiar from modern data.
Journal of Financial Markets Working paperJournal of Financial Markets 4 (2001) 1–32.
The index, three vintages
| Series | Ann. | Vol. | 1925 level |
|---|---|---|---|
| 2015 data | −1.10% | 97.0% | 29 |
| 2020 revision | 1.57% | 12.9% | 564 |
| 2021 data, rebuilt | 1.61% | 12.8% | 587 |
Price appreciation only, dividends excluded; index = 100 in January 1815. The 2015 column is shown to make a point about transcription error, not because it should be used — see what the revision fixed.
The market, reconstructed
A price-weighted index of everything quoted in New York, chained month by month on the securities that appear in both months. Toggle the vintages against each other, or jump to a panic.
Panics, closures, and the shape of the record
What the index registers
Where the record is blank
Twenty-nine months in 111 years carry no quotation at all, and they are not all the same kind of silence.
| Months | Why |
|---|---|
| Mar–Apr 1817 | Not collected — source now digitised |
| Jan–Nov 1822 | Not collected — source now digitised |
| Mar–Dec 1848 | Not collected — source now digitised |
| Dec 1858 | No digitised source located |
| Jul–Nov 1914 | The exchange was closed |
The 1914 gap is history rather than a defect: the NYSE suspended trading on 31 July 1914 as the European exchanges closed, and did not resume in full until December.
The other twenty-four months were long described here as having no surviving price list. That is no longer true. The New-York Shipping and Commercial List — a twice-weekly paper carrying the quotations “corrected yesterday by the New-York Stock and Exchange Board” — was digitised by FRASER at the Federal Reserve Bank of St. Louis, and covers twenty-three of the twenty-four. Those months have now been transcribed and are published below as a separate file. Only December 1858 remains without a located source.
The published index still carries a return through every gap by spreading the across-gap return geometrically over the missing months, which is why the series never shows a jump at a reopening. The new transcription is not folded into that index.
What the revision fixed
A database assembled by hand from newspaper columns accumulates transcription error, and a price-weighted index is unforgiving of it: one stray digit in one stock moves the whole market. The August 2020 revision documents forty-odd such corrections. Two of them dominate everything else.
| Security | Month | Recorded | Corrected to |
|---|---|---|---|
| Metropolitan Bank | Dec 1853 | $34,705 | — |
| Illinois State Bank | Dec 1850 | $34,997 | — |
| Mechanics' Bank | Jan 1818 | $616 | $116 |
| Harlem R.R. pref. | Jul 1858 | $2,325 | $23.25 |
| Joliet & Chicago RR | Aug 1865 | $990 | $99 |
| Auburn & Syracuse R.R. | Apr 1844 | $619 | $119 |
Neighbouring months put Metropolitan Bank near $106 and Illinois State Bank near $10; both entries were withdrawn. Sources: revision notes, August 2020 and update notes, September 2021.
The cost of two digits
Those two entries alone are the difference between a market that compounds gently upward and one that appears to lose almost everything. On the 2015 data the index shows a +951% month in December 1853 and a −93% month in January 1854 — a round trip that never happened — and annualised volatility of 97.0% against 12.9% after correction.
| 2015 data | 2020 revision | |
|---|---|---|
| Annualised | −1.10% | 1.57% |
| Volatility | 97.0% | 12.9% |
| Best month | +951% | +22.6% |
| Worst month | −92.6% | −20.2% |
| Level, Dec 1925 | 29 | 564 |
The September 2021 update went the other way and added data rather than removing it: 950 prices recovered from the Commercial and Financial Chronicle on HathiTrust, filling months that had been empty in 1866–67, 1893, 1897, 1906, 1913, 1914, 1918 and 1923. Rebuilding the index on the fuller data lifts long-run appreciation from 1.57% to 1.61% a year.
Before the Board, 1800–1859
The monthly file begins in 1815, but the newspapers do not. Four New York commercial papers — the Price Current, the Shipping and Commercial List, and the Commercial Advertiser — printed price lists from 1800, and the project transcribed them: 21,145 quotations of 74 securities, matched to Bayley's National Loans of the United States so that every federal issue can be tied to the statute that authorised it.
What is quoted there is the debt of the early republic. The 6% stock of 1790 — the funding-act debt of Hamilton's settlement — trades throughout. So do the 8% Loan of 1798, the 6s issued to pay for Louisiana, and, one after another, the war loans of 1812, 1813, 1814 and 1815: you can watch the United States finance a war at the price the market demanded for it.
From 1843 the Commercial Advertiser series carries weekly bid and asked quotations for seven federal loans with current yields computed against them — a weekly government yield series for the two decades before the Civil War.
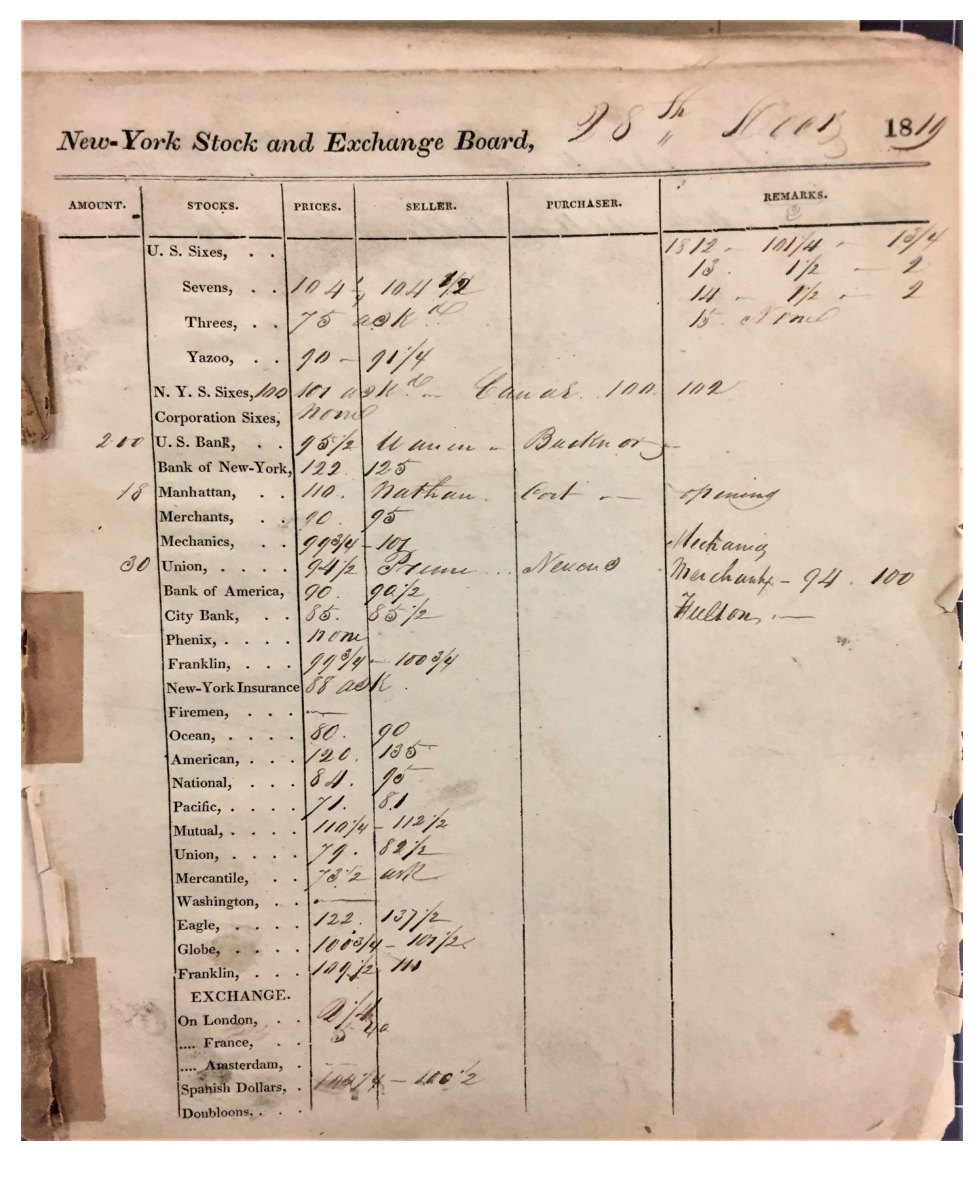
Filling the blank months
Twenty-three of the twenty-four blank months have now been transcribed from the New-York Shipping and Commercial List, which printed the Board’s quotations twice a week from 1815. The 1817 and 1822 tables give a bid and an ask for a standing list of securities, with a “sales” annotation marking where a trade actually took place. By 1848 the paper had switched to printing actual transactions with volume instead, so those months carry traded prices rather than quotations.
Prices follow the rule used for the original database: the transaction price where one is printed, otherwise the average of bid and ask.
| Months | Basis | Observations |
|---|---|---|
| Mar 1817 | bid / ask quotations | 22 |
| Jan–Nov 1822 | bid / ask quotations | 253 |
| Mar–Dec 1848 | transactions, with volume | 274 |
| total | 22 months | 549 |
Securities are identified by the codes of Sylla, Wilson and Wright, Price Quotations in Early United States Securities Markets, 1790–1860 (ICPSR 4053), so the file merges directly with theirs. The US federal loans, which their New York set does not carry, are given codes of their own anchored on Bayley’s National Loans of the United States (1882).
Read this before using it
This file is machine transcription, not hand-verified data, and it is deliberately kept separate from the monthly price database rather than merged into it.
Each page was read three times independently and the majority value taken. Where the three
readings disagreed, the row is flagged: 74% of the published observations had all three agree,
the remaining 26% did not and are marked passes disagreed – unverified in the
confidence column.
Agreement is not proof. On a hand-check of two 1817 issues, about one cell in eight that the transcription was confident about still needed correcting. Whole numbers are considerably more reliable than the fractions: readings agree on the whole number 93–95% of the time and within one point 95% of the time, so treat the prices as good to about half a point, not to the fraction.
April 1817 is withheld. That issue set the table sideways across the foot of the page and the transcription is not good enough to publish; it needs to be keyed by hand. December 1858 has no digitised source. Full method, measured error rates and the security crosswalk accompany the download.
The structure of the news
The Structure of New York Financial News
Wall Street Journal, 1889–1930
The prices on this page are one half of the record; what was written about them is the other. A companion project applies topic modelling and semantic-change measurement to the full text of the Wall Street Journal across the same decades, tracking how financial reporting moved from terse price notation toward narrative.
Open the siteWho collected this
The database is the work of many hands over more than two decades. The 2020 corrections and the 2021 recovery of prices from the Commercial and Financial Chronicle were carried out with the assistance of Sophia Gu, Alex Payne, Chris Payne, David Shen, Ethan Zhang and Lauren Zhang. The government security prices and the loan descriptions were matched against Bayley's National Loans of the United States (1882).
Any use of these data should cite: data made available through the International Center for Finance at Yale University.
Data & links
Download & replicate
All ICF source files (zip) Monthly index, three vintages Annual index levels Securities quoted by industry Pre-exchange prices, 1800–1859 Government yields, weekly Government prices, weekly Blank months transcribed, 1817–1848 Security crosswalk (ICF · SWW · SCL) Transcription methodology build_nyse_index.py Revision notes, 2020 Update notes, 2021The ICF page is the canonical home of the source files; copies are hosted here so the page and
its charts remain reproducible. Note that four files are published there with an extension that does not match
their contents — three .xls files are in fact CSV and one .txt is RTF; the
copies in the zip are renamed to their true formats.